
AI Business Intelligence
Practical guideBlended Reporting: One Commercial View Across Your Channels
How blended reporting creates one commercial view across revenue, spend and channels, and why managed reporting beats another DIY dashboard.
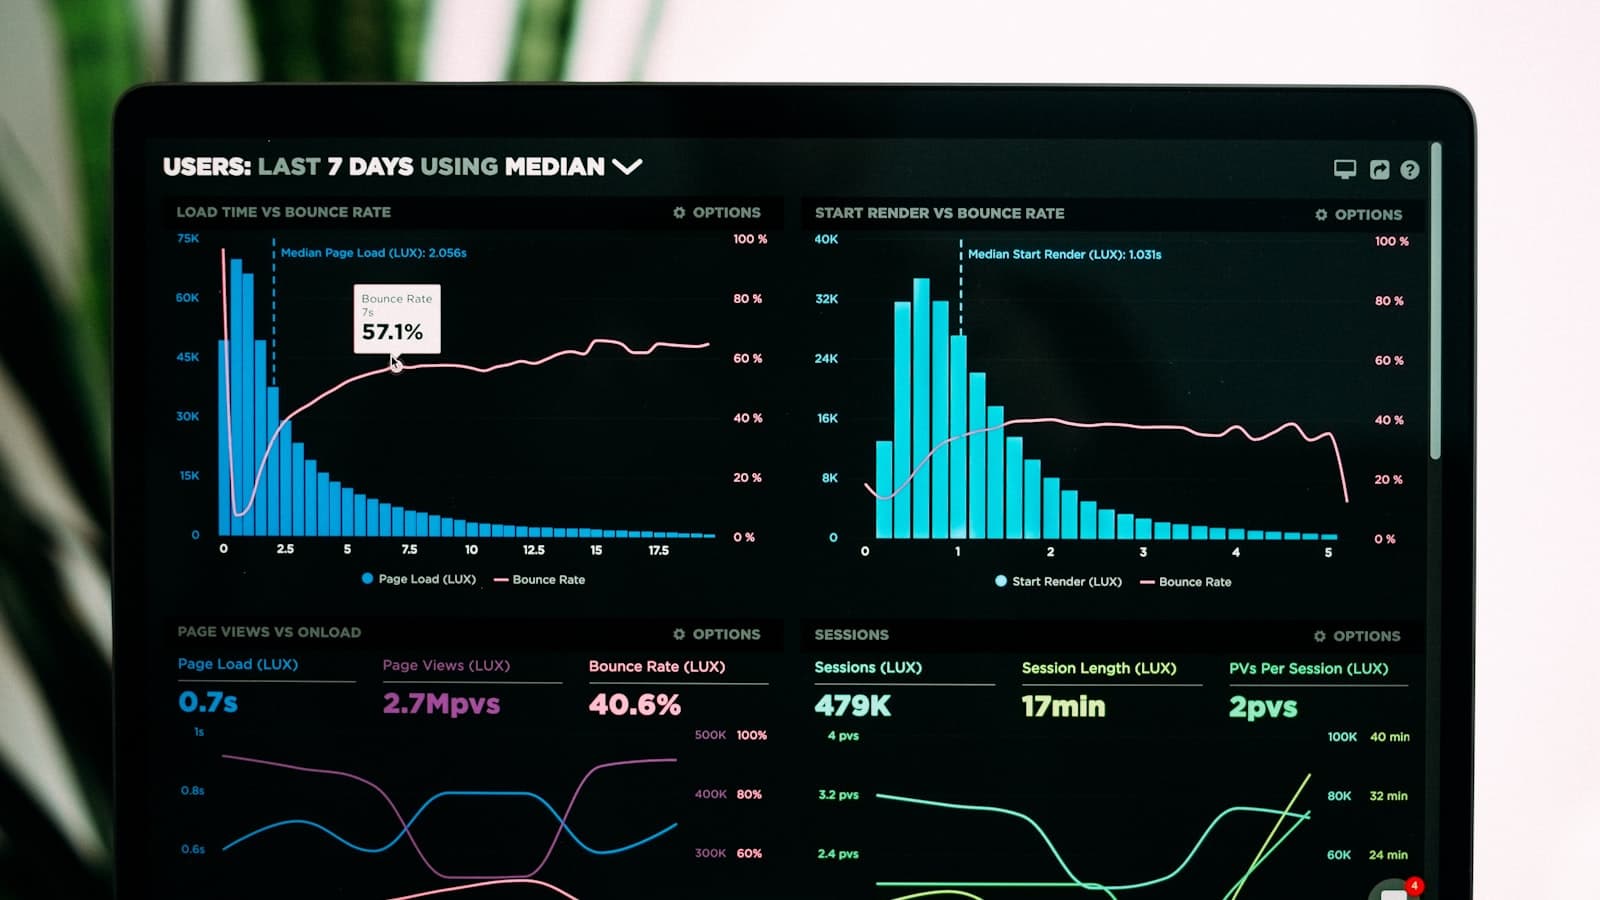
The problem blended reporting is meant to solve
Most growth teams do not lack dashboards. They lack a shared commercial view. Meta reports one attributed return, Google reports another, Shopify reports net sales, finance reports margin and cash, and email reports revenue from campaigns that partly captured demand created elsewhere. Each interface can be internally consistent and still leave leadership unable to answer a simple question: what changed in the business, and what should we do next?
Blended reporting exists to reduce that fragmentation. It does not invent perfect causality. It organises revenue, cost, channel activity and selected operational measures so that teams can compare like with like, spot contradictions early and make allocation decisions under uncertainty. The AI Business Intelligence guide explains the broader operating system; this article focuses on the commercial view across channels.
Build a data model around commercial entities
A usable blended model starts with entities, not charts. Orders, products, customers, campaigns, spend records and, where relevant, inventory or fulfilment events need stable identifiers and join rules. If campaign names are free text chaos, if product identifiers differ between ads and the store, or if refunds are recognised on inconsistent dates, the dashboard will look finished while remaining commercially unreliable.
Define grain carefully. Daily channel spend can sit beside daily net sales without claiming that every sales dollar was caused by that day's media. Customer acquisition views may need cohort timing that weekly campaign summaries cannot support. Choose the grain that matches the decision. Executive allocation often needs weekly or monthly commercial summaries; specialists need deeper diagnostics without contaminating the leadership layer.
| Entity | Primary source | Join risk | Governance need |
|---|---|---|---|
| Orders and net sales | Shopify or revenue system | Tax, shipping and refund timing | Sales truth definition |
| Media spend | Ad platforms and invoices | Timezone and currency mismatches | Spend completeness checks |
| Campaigns | Platforms plus naming standards | Renames and missing UTMs | Campaign dictionary |
| Products | Commerce catalogue | SKU and variant mismatches | Product identity map |
| Customers | Commerce and CRM | Guest checkout and identity merges | New versus returning rules |
Select sources with an explicit hierarchy
Source hierarchy prevents endless argument. Commerce revenue should anchor sales truth. Finance should own margin and recognised cost rules. Advertising platforms should explain delivery, auction conditions and their attributed view. Analytics can help with session and landing behaviour. No source wins every category. The hierarchy should state which system is authoritative for each concept and how known differences are documented.
Connection quality matters as much as source selection. Incomplete spend imports, delayed conversion syncing and broken product feeds create false movements that teams then try to manage. Freshness indicators, reconciliation totals and exception alerts belong in the operating design. A beautiful chart without a completeness warning invites false confidence.
Australian ecommerce operators often need local nuance in the same model: GST treatment, freight cost variability and marketplace or wholesale channels that sit beside direct Shopify demand. If those realities are excluded, blended efficiency can look healthy while cash and contribution deteriorate. Related measurement topics are covered in Marketing Analytics and ROAS vs MER.
Choose metrics that support allocation decisions
A blended scorecard should stay short at the top. Net sales, contribution where available, total media spend, blended efficiency such as MER, new-customer share, and one or two guardrails such as refund rate or stock risk are usually enough for leadership. Beneath that, specialists can inspect channel ROAS, creative diagnostics, product concentration and funnel stages. The hierarchy matters because mixed audiences in one flat dashboard create mixed conversations.
Separate observed facts from causal claims. MER may weaken after spend rises; that is an observation. Whether the incremental spend created insufficient demand is an interpretation that may need tests, lag analysis and customer-mix review. Attribution reports can inform the investigation, but they should not silently rewrite the commercial ledger. See marketing attribution explained for model limits.
- Define each metric's formula, source, period and exclusions.
- Show denominators and absolute bases beside rates.
- Reconcile platform totals to the revenue and spend anchors.
- Record known limitations in the same place users see the chart.
- Review whether the metric still earns its place each quarter.
Why managed reporting beats another DIY dashboard
Many businesses attempt blended reporting as a one-off dashboard project. The prototype may look convincing for a month. Then campaign naming changes, a new channel is added, refund logic is revised, an analyst leaves and the workbook quietly diverges from finance. The failure is rarely visualisation. It is ownership.
Blended Reports is Attah Digital's managed business intelligence platform. Attah Digital implements and manages it for clients: agreed data connections, commercial definitions, decision-ready views and ongoing reporting management. It is not positioned as a DIY dashboard tool or unmanaged self-serve SaaS. The managed model exists because trustworthy blended reporting requires continuing reconciliation, definition control and analysis, not only an initial chart build.
If your team is spending meeting time arguing about whose export is correct, start with one decision such as monthly acquisition allocation, then build the minimum governed view required to support it. For reasoning failures that persist even after systems are connected, read Why Most Businesses Misread Their Data.
FAQ
Frequently asked questions
What is blended reporting?
It is a governed commercial view that brings revenue, spend and channel activity together so teams can make allocation decisions without treating every platform dashboard as a separate truth.
Does blended reporting replace attribution?
No. Attribution remains useful for journey and delivery diagnosis. Blended reporting keeps commercial totals and efficiency anchored while attribution is interpreted with appropriate humility.
What is MER in this context?
Marketing efficiency ratio typically compares revenue to marketing spend at a business level. It is a pressure test for overall efficiency, not a substitute for channel diagnostics.
Why do DIY blended dashboards fail?
They often lack ongoing ownership for definitions, reconciliations, source changes and analysis. The charts remain while trust decays.
What is Blended Reports?
Blended Reports is Attah Digital's managed business intelligence platform. Attah implements and manages the reporting environment and analysis for clients; it is not a DIY dashboard product.
Where should a business start?
Start with one recurring commercial decision, agree the source hierarchy and metric definitions, reconcile the totals, then expand only where additional detail changes actions.
Written by
Attah Digital
Attah Digital builds AI-powered growth systems, paid advertising engagements, ecommerce experiences, business intelligence platforms and production AI systems for Australian businesses.
About Attah DigitalRelated reading
Continue through this topic

AI Business Intelligence
AI Business Intelligence: From Disconnected Data to Better Decisions
Read article
Marketing Analytics
Marketing Analytics: A Decision Framework Beyond Platform ROAS
Read article
Marketing Analytics
ROAS vs MER: Which Metric Should Guide Ecommerce Growth?
Read article
AI Business Intelligence
Why Most Businesses Misread Their Data
Read articleConnected reporting
Create one commercial view of performance
Blended Reports is Attah Digital's managed business intelligence platform, connecting the channels that matter with ongoing analysis and practical recommendations.
Learn about Blended Reports